


Burning up the forest in our Kitchens
Chabungbam Amuba Singh *
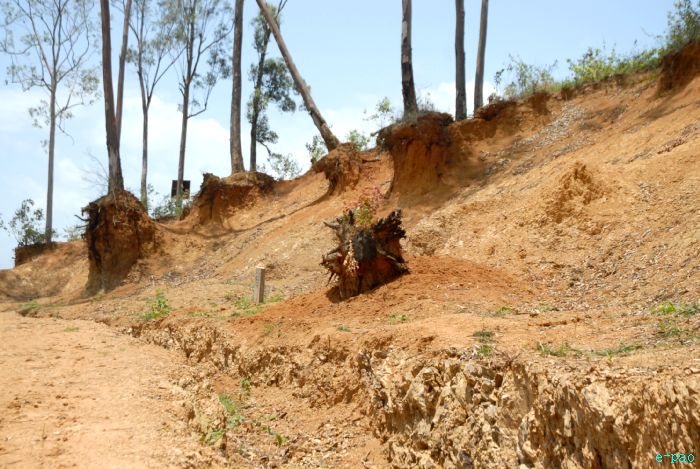
A cut tree in Imphal area
The Supreme Court's mandate against felling of trees has a plain scientific rational. It is simple. We need oxygen to breathe and we desire to mitigate the global warming. The FOREST caters to both our 'need' and 'desire'. It is the forest which is maintaining a dynamic equilibrium of 21 p.c. oxygen and 0.03 p.c. carbon-di-oxide in the atmosphere. No forest means decreasing oxygen and increasing carbon-di-oxide content of the atmosphere and death for all in no time.
Bear with a little bit of basic science. The tree-wood is 50 per cent carbon. The chemical formula of carbon-di-oxide signifies that one tonne of carbon storage in the forest represents release of 2.67 tonnes of oxygen into the air and removal of 3.67 tonnes of carbon-di-oxide from the atmosphere.
Globally, only 9.4 percent of the earth's surface (31 p.c. of the total land area) is covered by forest. In 2010 FAO estimated the world's forest area to be just a little over 4 billion hectares (4033 million hectares). More than half of it (53 p.c.) are found in the five countries - the Russian Federation, Brazil, Canada, U.S.A., and China.
The list is given in descending order of the absolute size of the forest area in the country. The decline along the list is very steep, - while the Russian Federation has 809 million hectares of forest China has only 206 million hectares. Brazil has forest cover of more than 70 percent of its land area, the Russian Federation about 50 percent - while India and China have more or less equal forest cover of about 21-22 percent of their respective geographical areas, ( the neighbouring Myanmar having 63.6 percent forest cover).
Global Forest Resources Assessment 2010 report of FAO says, "Deforestation, mainly due to conversion of forest into agricultural land, shows signs of decreasing in several countries but continues at an alarmingly high rate in others". Over the two decade period 1990-2010, the annual net loss of forest area is highest in Brazil followed by Indonesia, while the rate of annual loss (as percentage of the total forest area) is highest in Nigeria followed by Zimbabwe. Over the same period, there had been net gain of forest area in a few countries- the highest being in China, distantly followed by the U.S.A.. The rate of annual gain (as percentage of the total forest area) is highest in Vietnam, followed by China.
China's forest area expanded at the rate of 2 million hectares/year in the decade 1990-2000 and at 3 million hectares/year in the following decade 2000-2010; the rate of annual gain being 1.2 % for the decade 1990-2000 and 1.57% for the decade 2000-2010. The expansion is attributed to massive afforestation programmes the country has taken up along with its ambitious plan of hydropower generation. This is a lesson every nation has to learn.
On the whole, the world has lost 2 % of its forest in the decade 1990-2000 and 3 % in the following decade 2000-2010.
India's forest cover of 21 percent ( 23.8 p.c. if Trees Outside Forest is included) of its geographical area is very unevenly distributed. The North-East India, which constitutes just 8 % of the total geographical area of the country, has 66 % forest cover and accounts for one-fourth of the total forest of the country. Barring the North-East the rest of India has only 17 % forest cover. The Continuous Vegetation Fields of the North-East India joins up with the South East Asia zone of global forest pattern.
Let us now take a peep into the tiny domain of forest in Manipur in a dynamical perspective. The following table, constructed from the records of the Forest Survey of India, gives an idea of the temporal dynamics of the forest in Manipur over the last two and half decades. First we explain the abbreviations and the classification scheme of the Forest Survey of India.
1. Very Dense Forest (VDF): All lands with tree cover of canopy density of 75 % and above.
2. Moderately Dense Forest (MDF): All lands with tree canopy density between 40 % and 70 %.
3. Open Forest (OF): All lands with tree cover of canopy density between 10 % and 40 %.
4. Scrub: All forest land with poor tree growth mainly of small or stunted trees having canopy density less than 10 %.
Prior to the 2003 report the two categories of VDF and MDF were combined into a single category of Dense Forest (DF). The term forest cover does not include scrub and isolated stretch of vegetated land measuring less than one hectare.
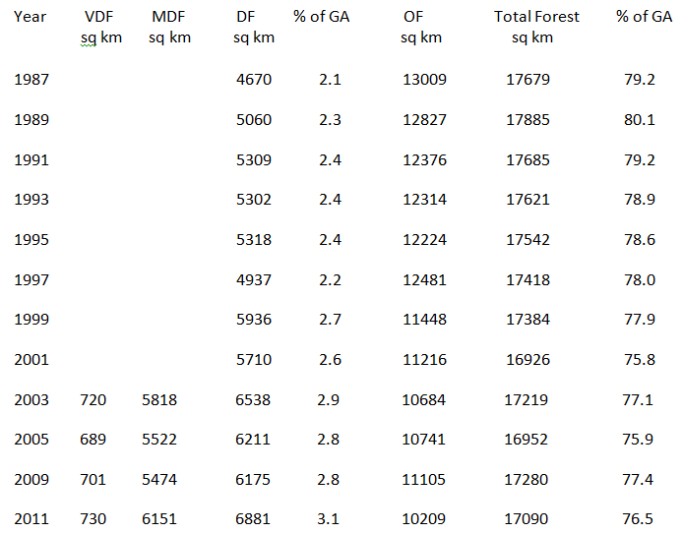
Table-1: Forest cover of Manipur as given in India State of Forest Reports
Geographical Area (GA) of Manipur = 22,327 sq km
The table shows a clear trend of increase of the Dense Forest and decrease of the Open Forest . In the 24 years period 1987-2011 the Dense Forest has increased by 2211 sq km while the Open Forest has decreased by 2800 sq km resulting in a net loss of 584 sq km of forest area. The annual loss rate works out to be 0.14 % which is substantially lower than the global average.
Decadal change of the forest cover over the period 1989-1999 is a decrease of 501 sq km which works out to an annual loss rate of 0.28 % which is very close to the global loss rate of 0.3 % annual for the decade 1990-2000.
A positive trend worth highlighting is that the decade 2001-2011 saw a net gain of forest area by 164 sq km which works out to 0.1 % annual increase. Globally, over the period 2000-2010 there was net loss of forest at the annual rate of 0.2 %.
'Shortening of shifting cultivation cycle and biotic pressure'- is the reason cited by the FSI for the decrease in forest area in the North-Eastern states. I have no statistics on the Jhumia population of Manipur. The Dy. C.M. said in the Assembly on 25 June 2013 that there are 50,000 Jhumia families in Manipur. Assuming an average holding of 0.5 hectare/family, the jhum-affected area comes out to be about 250 sq km. (Last year a local daily reported an (FSI's!) estimate of 70,000 families practicing shifting cultivation over 900 sq km of forest land in the hills of Manipur. This seems to be exaggerated, because it implies an unrealistic 1.3 hectares per family).
In Manipur nearly two-thirds of the five lakh households use wood as cooking fuel (Census-2011). I am reminded of the FSI report that Manipur consumes 2.5 million tonnes of wood as kitchen fuel (2.1 million tonnes in the 2009 report). We can convert this into equivalent forest area depletion approximately by taking into account the normal density of wood, the growing stock of wood in the forest and the size of the forest cover. A conservative estimate yields about 250 - 350 sq km as the forest area equivalent of the wood consumed annually as kitchen fuel. This is about the same size as the (estimated) area affected by jhuming. Note that the effect of fuel wood harvesting is accumulative while that of jhuming is not.
In other words, our need for kitchen fuel is impacting the forest much more severely than the Jhumias do. We are literally burning the forest in our kitchen.
While concluding I quote from GFRA-2010, -" Governments generally spend more on forestry than they collect in revenue". Also, when you buy a 70 cu. ft. timber just remember that during its life time it had given out 2-3 tonnes of oxygen and removed 2.5-4.0 tonnes of carbon- di-oxide from the atmosphere. So, save the forest - not so much as an economic resource, but as a saviour of life on earth.
* Chabungbam Amuba Singh wrote this article for e-pao.net
The writer is Former Vice-Chancellor, Manipur University and can be contacted at camuba(dot)singh(at)gmail(dot)com
This article was posted on October 21, 2013.
* Comments posted by users in this discussion thread and other parts of this site are opinions of the individuals posting them (whose user ID is displayed alongside) and not the views of e-pao.net. We strongly recommend that users exercise responsibility, sensitivity and caution over language while writing your opinions which will be seen and read by other users. Please read a complete Guideline on using comments on this website.


