


Religion profile of Manipur : An impact study
- Part 1 -
Prof RK Narendra Singh *
The religion of a society is a cultural system of behaviors and practices that relate humanity to an order of existence. Since immemorial the religions have been taking place a significant role towards the human civilization. At the same time the growth's
trend of various religion affinities changes dramatically but initially, not much attention is deliberated seriously.
During 1980s, demographers realized the repercussion of religious imbalance in the world. It causes imbalance population growth, composition
and structure that hamper equilibrium condition of natural demographic phenomenon. Now and then every country or state, even society has very much concern about this manmade menace of religious imbalance as it become a serious demographic catastrophe.
Craft-resist domination (minority crafts to dominate majority while majority resists it) is rolled out in the sense that the minority religion community tries to craft or boost their folks, in the name of religion, to dominate the majority in terms of either
enhancing population or proselytizing religions or both while majority community resists or tries to keep status quo. Eventually a conflict situation is created among the people of diverse religions.
It is really a dangerous form of demographic terrorism . The situation is not exception in Manipur. It makes demographic transition in terms of its composition, distribution and structure. For instance, the Hinduism is reducing faster and
eventually Hindu is no more majority religious group in Manipur after 2011. Christianity is growing faster and now Christian becomes the majority religious community in the state. Islam maintains the third rank in terms of its population.
There is a significantly different religion wise growth pattern among the districts as well as between hill and valley areas. Such drastic demographic transition causes social disorder and chaos that becomes difficult to maintain peace and harmony
amongst the people in the state
Religion profile: After the induction of seven districts recently, now the state has sixteen districts in all but their proper demarcation is not yet finalized. Thus interpretation is made here based on
the erstwhile nine districts, out of which five are segregated as hills while remaining four, the valley districts.
According to Census of India: 2011, there were 15 religions/sects/beliefs/persuasions in Manipur under Specific Religious Community.
They were
Baishnav/Vaishnav,
Buddhist,
Catholic,
Christian,
Ghasidas/Satnam/Satnami,
Hindu,
Islam/Muslim,
Jain,
Kabir Panthi,
Lingayat/Veer Shaiva,
Meitei,
Protestant,
Sanatan Dharma,
Shakta, and
Sikh.
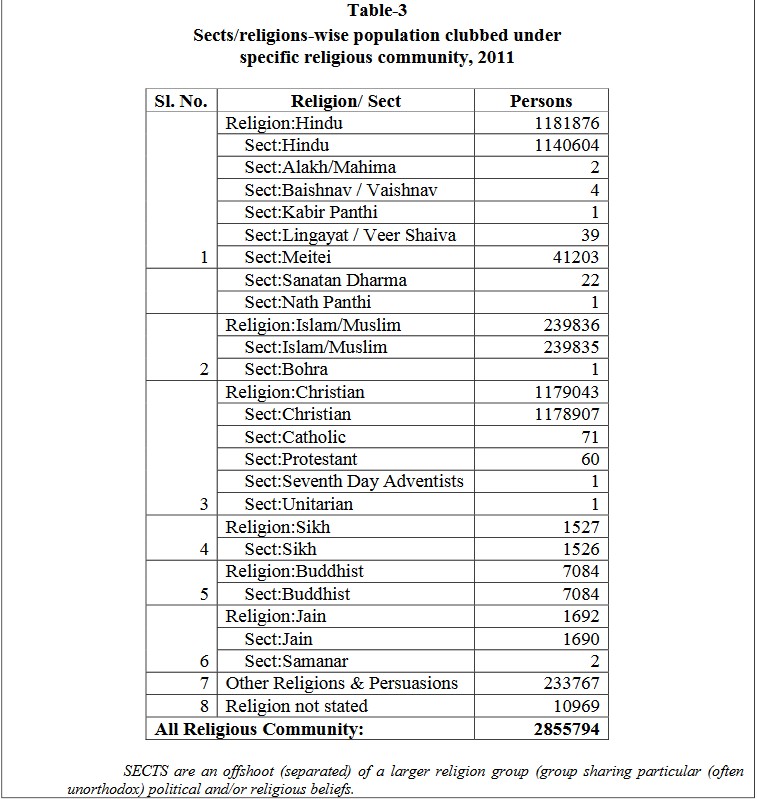
Besides, in the same census year, there were 35 such religions/sects/beliefs/persuasions under 'Other religions and persuasions' in Manipur.
They were
Animist, Apo Rangang, Bahai/Bahais, Chang Naga, Chimprai,
Dongi, Doni Polo/Sidonyi Polo, Haokip, Heraka, Jews/Judaism,
Kaman/Miju Mishmi/ Kaman Mishmi/Miju, Karbi/Mikir,
Khadia/Kharia, Khasi, Kheduala, Marangboro,
Maring, Miri/Mishing, Mizo, Muria, Naga,
Non-Christians, Pagan, Parsi/Zoroastrian, Rang,
Rangang, Rongmei, Rongrang/Tangsa Rongrang,
Sanamahi, Songsarek, Tadvi, Tangsa Tikhak/Tikhak,
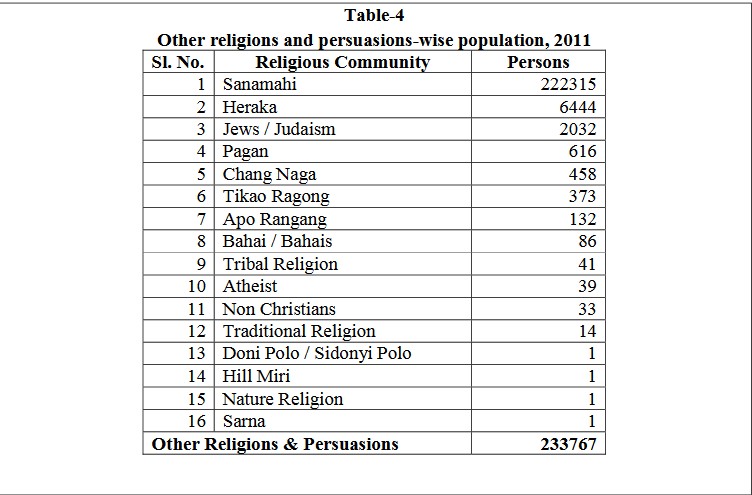
Traditional Religion, Tribal Religion and Yumasam.
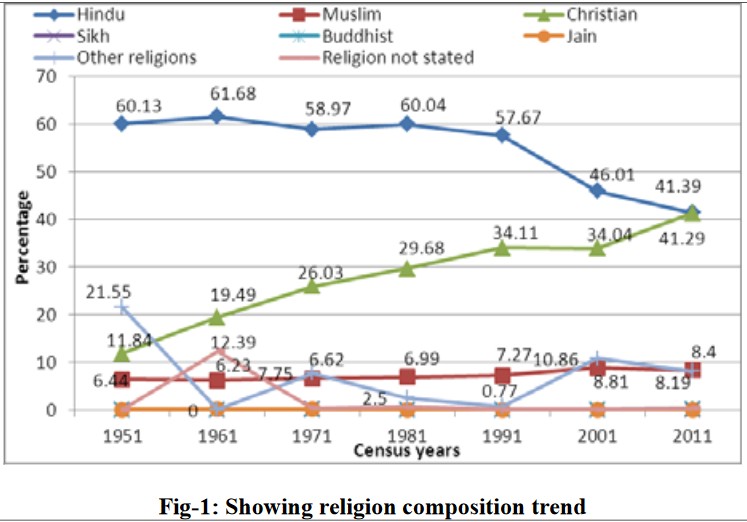
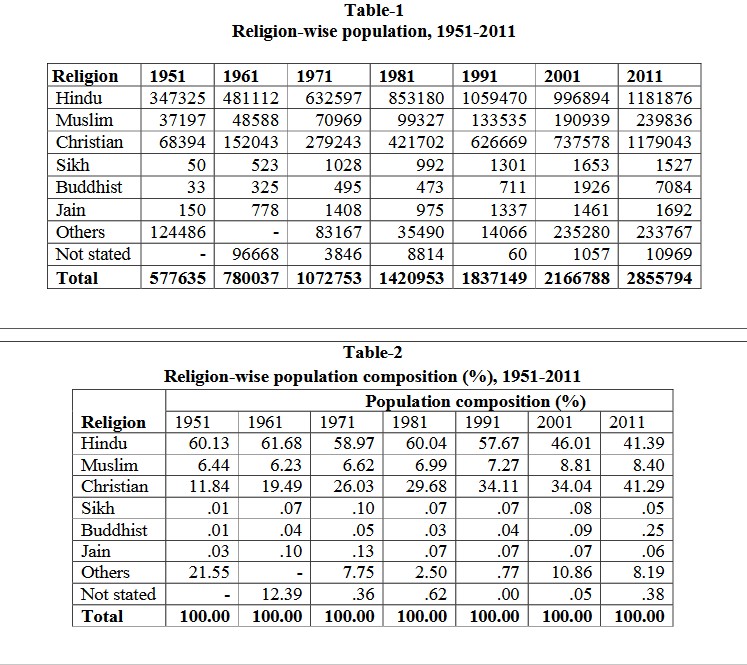
Out of the 2855794 people in Manipur (Census 2011) there were 1181876 (41.39%) Hindus, 239836 (8.40%) Muslims, 1179043 (41.29%) Christians, 1527 (.05%) Sikhs, 7084 (.25%) Buddhists, 1692 (.06%) Jains, 233767 (8.19%) Other religions
and 10969 (.38%) Religion not stated. In 1951, the respected percentages were 60.13, 6.44, 11.84, .01, .01, .03, 21.55 and no report for Religion not stated.
Now in 2011, Hindu and Christian had the highest religion composition in the state with a same percentage of around 41% each which was followed by Muslim and Other Religions & Persuasions with around 8% each; and remaining religions viz., Sikh,
Buddhist, Jain, and Religion note stated had less than 1% each population composition in the state.
Out of the six Indian major religion groups and others two groups 6 Other religions and persuasions, and
Religion not stated - only two religious communities viz., Hindu and Christian occupied more than 80% while the remaining less than 20% occupied by the others minorities communities out of which Muslim shared around 8%.
Hindu and Christian communities almost equally shared in 2011, but this rendezvous happen as, during the last 60 years, Hindu population composition declined from 60.13% to 41.39%, and other religions from 21.55% to 8.19% as against
Christian population composition increased at a faster rate from 11.84% to 41.29% and Muslim from 6.44% to 8.40%. The gap of population composition between Hindu and Christian was narrowing faster as it was 48.29% in 1951 and only 0.10% in 2011.
The Christian community could definitely leftovers its counterpart the Hindu community after 2011. The state had registered a dramatic decline of population growth with decadal growth rate of 17.94% (2001) as against 29.29% (1991)
and thereafter witnessed a population spurt of 31.8% in 2011 which was running quite above the national figure of 17.64% (2011).
The unusual figures observed at 2001 and 2011were the upshots of excluding population of three sub-divisions of Senapati district viz., Mao Maram, Paomata and Purul in the census, 2001.
A much fluctuated decadal growth rates was observed among the minority religious communities and it was because of their less population compositions which might be affected due to few thousand in-migrant or out-migrant of their communities from
one census year to another.
However, when one looks at three major religion groups, the Hindu and the Christian had more or less declining growth rate since 1951 to 2001 (Hindus had negative growth in 2001 i.e., - 5.91%) while Muslim maintained
a slightly stagnant trend. There after the Christian's population spurt was witnessed (59.85%) followed by the Muslim (25.61%) and the Hindu (18.56%) in 2011.
Nonetheless, a great variation of growth rates at each census year was persisted over the religion groups. For instance; the Christian had decadal growth rates of 122.3% in 1951 while the Hindu and the Muslim had
38.52% and 30.62% respectively.
Abrupt decline of Christian's decadal growth rates from 1991 to 2001 and again spurts at 2011were due to the non-inclusion of population of three sub-divisions of Senapati district viz., Mao Maram, Paomata and
Purul in the Census, 2001. In any case, it is confirm that growth rate of Christian community is faster than its counterpart Hindu and Muslim communities; and again Muslim has faster than that of Hindu.
Overall decadal growth rate (%) from 2001 to 2011 for valley was 15.72% as against 61.87% for hill. It is further worthwhile to mention that the decadal growth rate for all the religion groups except Muslim and Buddhist were found
growing faster in hill than that of valley. Even the Hindu population was significantly growing faster in hill than valley. In contrast, Sikh, Jain and Other religion groups had negative decadal growth rate in valley.
To be contnued...
* Prof RK Narendra Singh wrote this article for The Sangai Express
The author is a Professor & Head of Biostatistics, Regional Institute of Medical Sciences (RIMS), Lamphelpat, Imphal (Manipur)
This article was webcasted on 25 April, 2019.
* Comments posted by users in this discussion thread and other parts of this site are opinions of the individuals posting them (whose user ID is displayed alongside) and not the views of e-pao.net. We strongly recommend that users exercise responsibility, sensitivity and caution over language while writing your opinions which will be seen and read by other users. Please read a complete Guideline on using comments on this website.


