


Immigrations into Manipur - an overview
- Part 3 -
Oinam Biren Singh *
It would be evident that maximum inflow observed in 2001 Census was from Assam with 5057 heads. It was followed by Bihar with 1902 persons. The third position is occupied by the people whose last residence was recorded to be Uttar Pradesh (UP).
The order of immigrations into Manipur for the first 15 States according to the size of migration were found to be Assam, Bihar, UP, Meghalaya, West Bengal, Tripura, Rajasthan, Nagaland, Mizoram, Uttaranchal, Arunachal Pradesh, Tamil Nadu, Maharastra, Kerala and Jharkhand. Of these 15 States, female migrants' number was more in the case of Assam, Nagaland and Mizoram but in the case of remaining 12 States, male immigrants were found to be out numbered the female immigrants.
The overall sex ratio of the immigrants was worked out to be 786 females per 1000males as against the sex ratio of 974 of Manipur State according to 2001. This will distort the demographic structure of the state to some extent. 3. Immigration into Manipur from Aboard: Migration is not confined within a country.
Due to one or other reasons some are going out and some are coming in. Census 2001 recorded immigrations into Manipur and also emigrations from Manipur. However, only the immigrants were taken into consideration.
A picture of the inflow of people from other countries according to 2001 census would be seen in table No.3 given below:
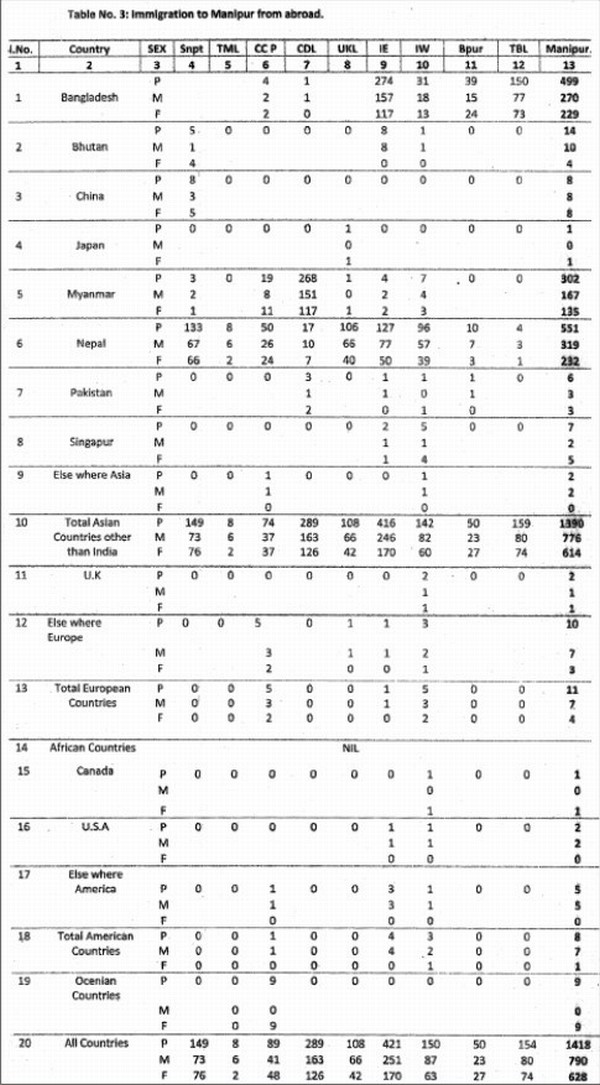
It would be evident that immigrations from aboard were mainly from Asian Countries. Of the total of 1418 immigrants from aboard, the immigrants from Asian countries other than India stood at 1390 which constituted 98.03 % of the total immigrants from aboard.
Of the Asian countries, immigration from Nepal begged the highest percentage which was worked out to be 39.64 % of the total immigrants from the Asian countries. It was followed by immigrants from Bangladesh with a percentage of 32.30 to total immigrants from the Asian countries.
Next to Bangladesh, immigration from Myanmar scored a share of 21.73 % Immigrants from European, American and Ocenian countries were more or less negligible where there were no immigrants from the African countries as per 2001 Census.
4. Conclusion:
Present analysis covers immigrations into Manipur from the East and West however I could not cover age - pyramid and occupational structure of the immigrants. Therefore, the impact of the immigrants to demographic structure and also economy of the state could not be analysed.
However, it is clearly observed the quantum of immigrations into Manipur from other state of India and from aboard is declining from decade to decade commencing from 1971.
Concluded.....
* Oinam Biren Singh wrote this article for The Sangai Express
The writer is former Director of Econ & Statistics
This article was posted on August 22, 2012.
* Comments posted by users in this discussion thread and other parts of this site are opinions of the individuals posting them (whose user ID is displayed alongside) and not the views of e-pao.net. We strongly recommend that users exercise responsibility, sensitivity and caution over language while writing your opinions which will be seen and read by other users. Please read a complete Guideline on using comments on this website.


