


Immigrations into Manipur - an overview
- Part 1 -
Oinam Biren Singh *
Movement of people from one place to another is termed as migration. It is of two kinds, one is inflow which is termed as 'immigration' and the other is outflow which is known as 'emigration'. However, we will discuss today, the aspects of immigrations leaving aside the pictures of emigrations.
There are 2 (two) factors of migration such as "push factors" and "pull factors". Push factors are those which can drive people to leave their old residences. Example are their home place/country may have lack of job opportunities, political instability lack of social as well as civil security, poor health care facility, lack of basic infrastructure, natural disasters etc.
Pull factors are just opposite to push factors. These are the factors that attract people to certain places/countries. Examples of pull factors are ample job opportunities, better living conditions, goad infrastructure, marriage, good governance, religious freedom, better health care facilities, better security etc.
Both push and pull factors may be further subdivided into economic, cultural and environmental aspects. In other words, the factors of migration may be termed as economic push/pull factors, Cultural push/pull factors and environmental push/pull factors.
Keeping the aforesaid factors of migration in view, we may see the picture of the quantum of immigrations into Manipur during the period from 1951 - 2001, based on the decennial population censuses of India in the table given below:
Table No. 1.1: Immigrants of Manipur during the period from 1951-2001 according the decennial Population Censuses
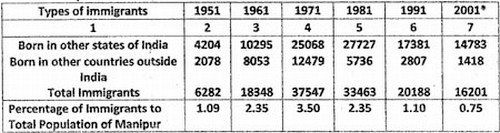
* Excludes 3-Sub-Divisions of Senapati
A large-scale immigration is observed in the wake of independence and partition of India in one hand and integration of Manipur with the union of India. Therefore, I have taken the year 1951 as the starting point. From the above table, it will be observed that there were a total of 6,282 immigrants according 1951 - Census, which constituted 1.09 per cent of the total population of Manipur. Out of the total of 6,282, as many as 4,204 , persons were from other States of India where the remaining 2,078 immigrants were from foreign countries. Of the foreign countries as many as 1009 were refugees from Bangladesh (the then East Pakistan) which constituted 48.56 per cent of the foreign immigrants. Another feature of the Bangladeshi immigrants was that of sex ratio which was worked out to be 841 - females per 1000 males.
The tune of immigrants was found increasing. In both the foreign nationals and Indian nationals born in other States outside Manipur. In 1961 Census, it was recorded to be 18,348 immigrants showing decadal growth of 192.70 per cent between 1951 and 1961. The total immigrants in 1961 was worked to be 2.35 per cent of the total State Population.
In 1971, there were a total of 37,547 immigrants, of which 25,068 were Indian nationals born in other States outside Manipur and 12,479 were foreign nationals. Census 1971 recorded the highest number of immigrants during the 50 years period from 1951 - 2001. It constituted 3.50 per cent of the total State population. The growth rate of immigrants between 1961-1971 was worked out to 104.64 per cent.
In 1981, the volume of immigrations into Manlpur was found to be declining as compared to the findings of 1971. It stood at 33,463 indicating a negative growth rate of 10.88 per cent during the-decade 1971-1981. It will be noticed from the above table that the size of foreign immigrants was decreasing from 1971- 1981 but immigrations of Indians, born in other States outside Manipur were still found to be increasing.
Further decrease was observed in 1991 as compared to 1981. The total number of immigrants recorded in 1991 was 20,188 which showed a negative growth of 39.67 per cent between 1981 - 1991 and total immigrants constituted 1.10 per cent to total State population. In 2001, the quantum of immigrants was reduced to 0.75 per cent of the State population.
Table No. 1.1 above shows only the recorded immigrations into Manjpur but cases of unrecorded or illegal immigrations could not be ruled out. I have not tried to estimate or otherwise guess the size of such immigrations. The overall pictures of immigrations recorded in 2001 may be seen in the following table No. 1.2.
Table No. 1.2: Migration by Place of Birth in respect of Manipur according to 2001 Census by district.
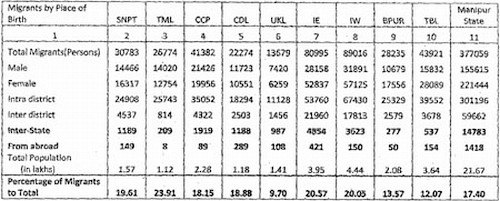
Excluded: 3 (three} - Sub - divisions of Senapati district
Note: Senapati (SNPT), Tamenglong (TML), Churachandpur (CCP), Chandel (CDL), Imphal East (IE), Imphal West (IW), Bishnupur (BPUR) and Thoubal (TBL).
It would be clear from table no. 1.2 that out of the total migrants of 3J 77J059 reported in 2001-census, as many as 3,01,196 which constituted 79.88 percent were found to be "Intra-District Migrants', where the volume of "Inter-District migration" was observed to be 59,662 which worked out to be of 15.82 per cent.
The real inflow of population to Manipur which includes "Inter-State" and "Migration from Aboard" constituted only 4.30 per cent of the total migrants. It stood at 16,201 persons in absolute term.
To be continued.....
* Oinam Biren Singh wrote this article for The Sangai Express
The writer is former Director of Econ & Statistics
This article was posted on July 29, 2012.
* Comments posted by users in this discussion thread and other parts of this site are opinions of the individuals posting them (whose user ID is displayed alongside) and not the views of e-pao.net. We strongly recommend that users exercise responsibility, sensitivity and caution over language while writing your opinions which will be seen and read by other users. Please read a complete Guideline on using comments on this website.


